
Author: Jason Brownlee
A classifier is only as good as the metric used to evaluate it.
If you choose the wrong metric to evaluate your models, you are likely to choose a poor model, or in the worst case, be misled about the expected performance of your model.
Choosing an appropriate metric is challenging generally in applied machine learning, but is particularly difficult for imbalanced classification problems. Firstly, because most of the standard metrics that are widely used assume a balanced class distribution, and because typically not all classes, and therefore, not all prediction errors, are equal for imbalanced classification.
In this tutorial, you will discover metrics that you can use for imbalanced classification.
After completing this tutorial, you will know:
- About the challenge of choosing metrics for classification, and how it is particularly difficult when there is a skewed class distribution.
- How there are three main types of metrics for evaluating classifier models, referred to as rank, threshold, and probability.
- How to choose a metric for imbalanced classification if you don’t know where to start.
Let’s get started.

Tour of Evaluation Metrics for Imbalanced Classification
Photo by Travis Wise, some rights reserved.
Tutorial Overview
This tutorial is divided into three parts; they are:
- Challenge of Evaluation Metrics
- Taxonomy of Classifier Evaluation Metrics
- How to Choose an Evaluation Metric
Challenge of Evaluation Metrics
An evaluation metric quantifies the performance of a predictive model.
This typically involves training a model on a dataset, using the model to make predictions on a holdout dataset not used during training, then comparing the predictions to the expected values in the holdout dataset.
For classification problems, metrics involve comparing the expected class label to the predicted class label or interpreting the predicted probabilities for the class labels for the problem.
Selecting a model, and even the data preparation methods together are a search problem that is guided by the evaluation metric. Experiments are performed with different models and the outcome of each experiment is quantified with a metric.
Evaluation measures play a crucial role in both assessing the classification performance and guiding the classifier modeling.
— Classification Of Imbalanced Data: A Review, 2009.
There are standard metrics that are widely used for evaluating classification predictive models, such as classification accuracy or classification error.
Standard metrics work well on most problems, which is why they are widely adopted. But all metrics make assumptions about the problem or about what is important in the problem. Therefore an evaluation metric must be chosen that best captures what you or your project stakeholders believe is important about the model or predictions, which makes choosing model evaluation metrics challenging.
This challenge is made even more difficult when there is a skew in the class distribution. The reason for this is that many of the standard metrics become unreliable or even misleading when classes are imbalanced, or severely imbalanced, such as 1:100 or 1:1000 ratio between a minority and majority class.
In the case of class imbalances, the problem is even more acute because the default, relatively robust procedures used for unskewed data can break down miserably when the data is skewed.
— Page 187, Imbalanced Learning: Foundations, Algorithms, and Applications, 2013.
For example, reporting classification accuracy for a severely imbalanced classification problem could be dangerously misleading. This is the case if project stakeholders use the results to draw conclusions or plan new projects.
In fact, the use of common metrics in imbalanced domains can lead to sub-optimal classification models and might produce misleading conclusions since these measures are insensitive to skewed domains.
— A Survey of Predictive Modelling under Imbalanced Distributions, 2015.
Importantly, different evaluation metrics are often required when working with imbalanced classification.
Unlike standard evaluation metrics that treat all classes as equally important, imbalanced classification problems typically rate classification errors with the minority class as more important than those with the majority class. As such performance metrics may be needed that focus on the minority class, which is made challenging because it is the minority class where we lack observations required to train an effective model.
The main problem of imbalanced data sets lies on the fact that they are often associated with a user preference bias towards the performance on cases that are poorly represented in the available data sample.
— A Survey of Predictive Modelling under Imbalanced Distributions, 2015.
Now that we are familiar with the challenge of choosing a model evaluation metric, let’s look at some examples of different metrics from which we might choose.
Taxonomy of Classifier Evaluation Metrics
There are tens of metrics to choose from when evaluating classifier models, and perhaps hundreds, if you consider all of the pet versions of metrics proposed by academics.
In order to get a handle on the metrics that you could choose from, we will use a taxonomy proposed by Cesar Ferri, et al. in their 2008 paper titled “An Experimental Comparison Of Performance Measures For Classification.” It was also adopted in the 2013 book titled “Imbalanced Learning” and I think proves useful.
We can divide evaluation metrics into three useful groups; they are:
- Threshold Metrics
- Ranking Metrics
- Probability Metrics.
This division is useful because the top metrics used by practitioners for classifiers generally, and specifically imbalanced classification, fit into the taxonomy neatly.
Several machine learning researchers have identified three families of evaluation metrics used in the context of classification. These are the threshold metrics (e.g., accuracy and F-measure), the ranking methods and metrics (e.g., receiver operating characteristics (ROC) analysis and AUC), and the probabilistic metrics (e.g., root-mean-squared error).
— Page 189, Imbalanced Learning: Foundations, Algorithms, and Applications, 2013.
Let’s take a closer look at each group in turn.
Threshold Metrics for Imbalanced Classification
Threshold metrics are those that quantify the classification prediction errors.
That is, they are designed to summarize the fraction, ratio, or rate of when a predicted class does not match the expected class in a holdout dataset.
Metrics based on a threshold and a qualitative understanding of error […] These measures are used when we want a model to minimise the number of errors.
— An Experimental Comparison Of Performance Measures For Classification, 2008.
Perhaps the most widely used threshold metric is classification accuracy.
- Accuracy = Correct Predictions / Total Predictions
And the complement of classification accuracy called classification error.
- Error = Incorrect Predictions / Total Predictions
Although widely used, classification accuracy is almost universally inappropriate for imbalanced classification. The reason is, a high accuracy (or low error) is achievable by a no skill model that only predicts the majority class.
For more on the failure of classification accuracy, see the tutorial:
For imbalanced classification problems, the majority class is typically referred to as the negative outcome (e.g. such as “no change” or “negative test result“), and the minority class is typically referred to as the positive outcome (e.g. “change” or “positive test result“).
- Majority Class: Negative outcome, class 0.
- Minority Class: Positive outcome, class 1.
Most threshold metrics can be best understood by the terms used in a confusion matrix for a binary (two-class) classification problem. This does not mean that the metrics are limited for use on binary classification; it is just an easy way to quickly understand what is being measured.
The confusion matrix provides more insight into not only the performance of a predictive model but also which classes are being predicted correctly, which incorrectly, and what type of errors are being made. In this type of confusion matrix, each cell in the table has a specific and well-understood name, summarized as follows:
| Positive Prediction | Negative Prediction
Positive Class | True Positive (TP)  | False Negative (FN)
Negative Class | False Positive (FP) | True Negative (TN)
There are two groups of metrics that may be useful for imbalanced classification because they focus on one class; they are sensitivity-specificity and precision-recall.
Sensitivity-Specificity Metrics
Sensitivity refers to the true positive rate and summarizes how well the positive class was predicted.
- Sensitivity = TruePositive / (TruePositive + FalseNegative)
Specificity is the complement to sensitivity, or the true negative rate, and summarises how well the negative class was predicted.
- Specificity = TrueNegative / (FalsePositive + TrueNegative)
For imbalanced classification, the sensitivity might be more interesting than the specificity.
Sensitivity and Specificity can be combined into a single score that balances both concerns, called the G-Mean.
- G-Mean = sqrt(Sensitivity * Specificity)
Precision-Recall Metrics
Precision summarizes the fraction of examples assigned the positive class that belong to the positive class.
- Precision = TruePositive / (TruePositive + FalsePositive)
Recall summarizes how well the positive class was predicted and is the same calculation as sensitivity.
- Recall = TruePositive / (TruePositive + FalseNegative)
Precision and recall can be combined into a single score that seeks to balance both concerns, called the F-score or the F-measure.
- F-Measure = (2 * Precision * Recall) / (Precision + Recall)
The F-Measure is a popular metric for imbalanced classification.
The Fbeta-measure measure is an abstraction of the F-measure where the balance of precision and recall in the calculation of the harmonic mean is controlled by a coefficient called beta.
- Fbeta-Measure = ((1 + beta^2) * Precision * Recall) / (beta^2 * Precision + Recall)
For more on precision, recall and F-measure for imbalanced classification, see the tutorial:
Additional Threshold Metrics
These are probably the most popular metrics to consider, although many others do exist. To give you a taste, these include Kappa, Macro-Average Accuracy, Mean-Class-Weighted Accuracy, Optimized Precision, Adjusted Geometric Mean, Balanced Accuracy, and more.
Threshold metrics are easy to calculate and easy to understand.
One limitation of these metrics is that they assume that the class distribution observed in the training dataset will match the distribution in the test set and in real data when the model is used to make predictions. This is often the case, but when it is not the case, the performance can be quite misleading.
An important disadvantage of all the threshold metrics discussed in the previous section is that they assume full knowledge of the conditions under which the classifier will be deployed. In particular, they assume that the class imbalance present in the training set is the one that will be encountered throughout the operating life of the classifier
— Page 196, Imbalanced Learning: Foundations, Algorithms, and Applications, 2013.
Ranking metrics don’t make any assumptions about class distributions.
Ranking Metrics for Imbalanced Classification
Rank metrics are more concerned with evaluating classifiers based on how effective they are at separating classes.
Metrics based on how well the model ranks the examples […] These are important for many applications […] where classifiers are used to select the best n instances of a set of data or when good class separation is crucial.
— An Experimental Comparison Of Performance Measures For Classification, 2008.
These metrics require that a classifier predicts a score or a probability of class membership.
From this score, different thresholds can be applied to test the effectiveness of classifiers. Those models that maintain a good score across a range of thresholds will have good class separation and will be ranked higher.
… consider a classifier that gives a numeric score for an instance to be classified in the positive class. Therefore, instead of a simple positive or negative prediction, the score introduces a level of granularity
– Page 53, Learning from Imbalanced Data Sets, 2018.
The most commonly used ranking metric is the ROC Curve or ROC Analysis.
ROC is an acronym that means Receiver Operating Characteristic and summarizes a field of study for analyzing binary classifiers based on their ability to discriminate classes.
A ROC curve is a diagnostic plot for summarizing the behavior of a model by calculating the false positive rate and true positive rate for a set of predictions by the model under different thresholds.
The true positive rate is the recall or sensitivity.
- TruePositiveRate = TruePositive / (TruePositive + FalseNegative)
The false positive rate is calculated as:
- FalsePositiveRate = FalsePositive / (FalsePositive + TrueNegative)
Each threshold is a point on the plot and the points are connected to form a curve. A classifier that has no skill (e.g. predicts the majority class under all thresholds) will be represented by a diagonal line from the bottom left to the top right.
Any points below this line have worse than no skill. A perfect model will be a point in the top right of the plot.
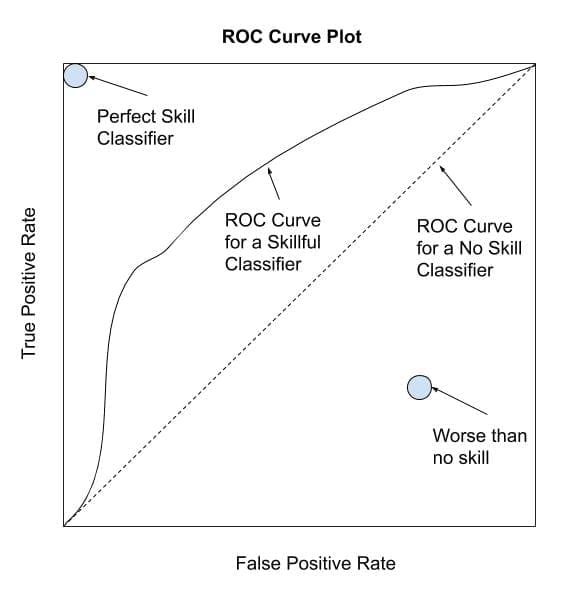
Depiction of a ROC Curve
The ROC Curve is a helpful diagnostic for one model.
The area under the ROC curve can be calculated and provides a single score to summarize the plot that can be used to compare models.
A no skill classifier will have a score of 0.5, whereas a perfect classifier will have a score of 1.0.
- ROC AUC = ROC Area Under Curve
Although generally effective, the ROC Curve and ROC AUC can be optimistic under a severe class imbalance, especially when the number of examples in the minority class is small.
An alternative to the ROC Curve is the precision-recall curve that can be used in a similar way, although focuses on the performance of the classifier on the minority class.
Again, different thresholds are used on a set of predictions by a model, and in this case, the precision and recall are calculated. The points form a curve and classifiers that perform better under a range of different thresholds will be ranked higher.
A no-skill classifier will be a horizontal line on the plot with a precision that is proportional to the number of positive examples in the dataset. For a balanced dataset this will be 0.5. A perfect classifier is represented by a point in the top right.
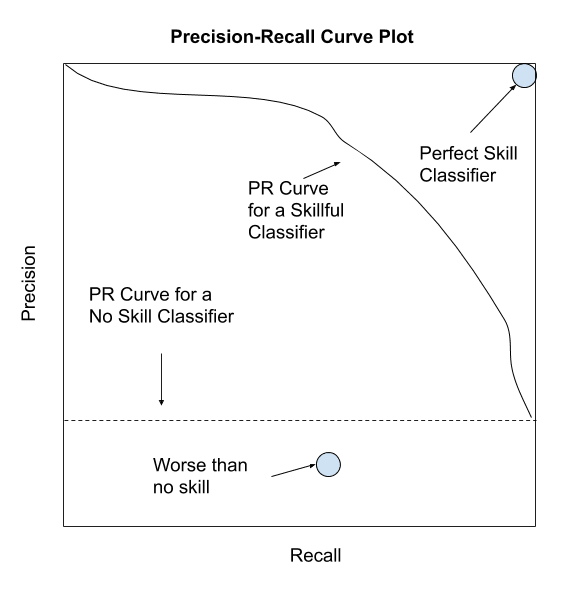
Depiction of a Precision-Recall Curve
Like the ROC Curve, the Precision-Recall Curve is a helpful diagnostic tool for evaluating a single classifier but challenging for comparing classifiers.
And like the ROC AUC, we can calculate the area under the curve as a score and use that score to compare classifiers. In this case, the focus on the minority class makes the Precision-Recall AUC more useful for imbalanced classification problems.
- PR AUC = Precision-Recall Area Under Curve
There are other ranking metrics that are less widely used, such as modification to the ROC Curve for imbalanced classification and cost curves.
For more on ROC curves and precision-recall curves for imbalanced classification, see the tutorial:
Probabilistic Metrics for Imbalanced Classification
Probabilistic metrics are designed specifically to quantify the uncertainty in a classifier’s predictions.
These are useful for problems where we are less interested in incorrect vs. correct class predictions and more interested in the uncertainty the model has in predictions and penalizing those predictions that are wrong but highly confident.
Metrics based on a probabilistic understanding of error, i.e. measuring the deviation from the true probability […] These measures are especially useful when we want an assessment of the reliability of the classifiers, not only measuring when they fail but whether they have selected the wrong class with a high or low probability.
— An Experimental Comparison Of Performance Measures For Classification, 2008.
Evaluating a model based on the predicted probabilities requires that the probabilities are calibrated.
Some classifiers are trained using a probabilistic framework, such as maximum likelihood estimation, meaning that their probabilities are already calibrated. An example would be logistic regression.
Many nonlinear classifiers are not trained under a probabilistic framework and therefore require their probabilities to be calibrated against a dataset prior to being evaluated via a probabilistic metric. Examples might include support vector machines and k-nearest neighbors.
Perhaps the most common metric for evaluating predicted probabilities is log loss for binary classification (or the negative log likelihood), or known more generally as cross-entropy.
For a binary classification dataset where the expected values are y and the predicted values are yhat, this can be calculated as follows:
- LogLoss = -((1 – y) * log(1 – yhat) + y * log(yhat))
The score can be generalized to multiple classes by simply adding the terms; for example:
- LogLoss = -( sum c in C y_c * log(yhat_c))
The score summarizes the average difference between two probability distributions. A perfect classifier has a log loss of 0.0, with worse values being positive up to infinity.
Another popular score for predicted probabilities is the Brier score.
The benefit of the Brier score is that it is focused on the positive class, which for imbalanced classification is the minority class. This makes it more preferable than log loss, which is focused on the entire probability distribution.
The Brier score is calculated as the mean squared error between the expected probabilities for the positive class (e.g. 1.0) and the predicted probabilities. Recall that the mean squared error is the average of the squared differences between the values.
- BrierScore = 1/N * Sum i to N (yhat_i – y_i)^2
A perfect classifier has a Brier score of 0.0. Although typically described in terms of binary classification tasks, the Brier score can also be calculated for multiclass classification problems.
The differences in Brier score for different classifiers can be very small. In order to address this problem, the score can be scaled against a reference score, such as the score from a no skill classifier (e.g. predicting the probability distribution of the positive class in the training dataset).
Using the reference score, a Brier Skill Score, or BSS, can be calculated where 0.0 represents no skill, worse than no skill results are negative, and the perfect skill is represented by a value of 1.0.
- BrierSkillScore = 1 – (BrierScore / BrierScore_ref)
Although popular for balanced classification problems, probability scoring methods are less widely used for classification problems with a skewed class distribution.
How to Choose an Evaluation Metric
There is an enormous number of model evaluation metrics to choose from.
Given that choosing an evaluation metric is so important and there are tens or perhaps hundreds of metrics to choose from, what are you supposed to do?
The correct evaluation of learned models is one of the most important issues in pattern recognition.
— An Experimental Comparison Of Performance Measures For Classification, 2008.
Perhaps the best approach is to talk to project stakeholders and figure out what is important about a model or set of predictions. Then select a few metrics that seem to capture what is important, then test the metric with different scenarios.
A scenario might be a mock set of predictions for a test dataset with a skewed class distribution that matches your problem domain. You can test what happens to the metric if a model predicts all the majority class, all the minority class, does well, does poorly, and so on. A few small tests can rapidly help you get a feeling for how the metric might perform.
Another approach might be to perform a literature review and discover what metrics are most commonly used by other practitioners or academics working on the same general type of problem. This can often be insightful, but be warned that some fields of study may fall into groupthink and adopt a metric that might be excellent for comparing large numbers of models at scale, but terrible for model selection in practice.
Still have no idea?
Here are some first-order suggestions:
- Are you predicting probabilities?
- Do you need class labels?
- Is the positive class more important?
- Use Precision-Recall AUC
- Are both classes important?
- Use ROC AUC
- Is the positive class more important?
- Do you need probabilities?
- Use Brier Score and Brier Skill Score
- Do you need class labels?
- Are you predicting class labels?
- Is the positive class more important?
- Are False Negatives and False Positives Equally Important?
- Use F1-Measure
- Are False Negatives More Important?
- Use F2-Measure
- Are False Positives More Important?
- Use F0.5-Measure
- Are False Negatives and False Positives Equally Important?
- Are both classes important?
- Do you have < 80%-90% Examples for the Majority Class?
- Use Accuracy
- Do you have > 80%-90% Examples for the Majority Class?
- Use G-Mean
- Do you have < 80%-90% Examples for the Majority Class?
- Is the positive class more important?
These suggestions take the important case into account where we might use models that predict probabilities, but require crisp class labels. This is an important class of problems that allow the operator or implementor to choose the threshold to trade-off misclassification errors. In this scenario, error metrics are required that consider all reasonable thresholds, hence the use of the area under curve metrics.
We can transform these suggestions into a helpful template.
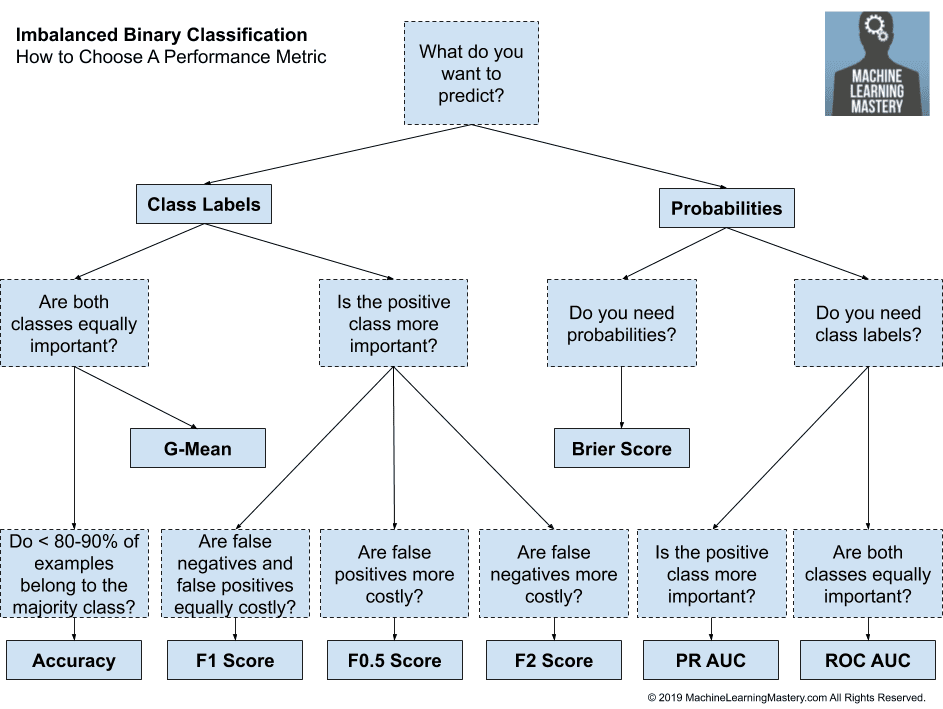
How to Choose a Metric for Imbalanced Classification
Further Reading
This section provides more resources on the topic if you are looking to go deeper.
Papers
- An Experimental Comparison Of Performance Measures For Classification, 2008.
- Classification Of Imbalanced Data: A Review, 2009.
- A Survey of Predictive Modelling under Imbalanced Distributions, 2015.
Books
- Chapter 8 Assessment Metrics For Imbalanced Learning, Imbalanced Learning: Foundations, Algorithms, and Applications, 2013.
- Chapter 3 Performance Measures, Learning from Imbalanced Data Sets, 2018.
Articles
- Precision and recall, Wikipedia.
- Sensitivity and specificity, Wikipedia.
- Receiver operating characteristic, Wikipedia.
- Cross entropy, Wikipedia.
- Brier score, Wikipedia.
Summary
In this tutorial, you discovered metrics that you can use for imbalanced classification.
Specifically, you learned:
- About the challenge of choosing metrics for classification, and how it is particularly difficult when there is a skewed class distribution.
- How there are three main types of metrics for evaluating classifier models, referred to as rank, threshold, and probability.
- How to choose a metric for imbalanced classification if you don’t know where to start.
Do you have any questions?
Ask your questions in the comments below and I will do my best to answer.
The post Tour of Evaluation Metrics for Imbalanced Classification appeared first on Machine Learning Mastery.