Home › Forums › Linear Regression › Simple linear regression with Python, Numpy, Matplotlib
Tagged: linear regression
- This topic has 0 replies, 1 voice, and was last updated 7 years, 5 months ago by
Charles Durfee.
-
AuthorPosts
-
December 23, 2018 at 9:16 pm #1452
Charles Durfee
KeymasterBackground info / Notes:
Find a line that models the relationship between a dependent variable and an independent variable.Equation:
y = α + b*xIn English: y is the dependent variable: what we are trying to predict, α is a constant: y at x = 0, b is a coefficient: slope of the line, x is the independent variable: what we think predicts y
Equation:
[SUM(Y) * SUM(X^2)] – [SUM(X) * SUM(XY)]
α = ________________________________________
n[SUM(X^2)] – [SUM(X)]^2n[SUM(XY)] – [SUM(X) * SUM(Y)]
b = ___________________________________
n[SUM(X^2)] – [SUM(X)]^2SUM = Summation
n = sample sizeR-Squared:
Tells us how good our prediction is, closer to 1 the better.
Equation:SUM(Y – Yi)^2
R^2 = 1 – _______________________________
SUM(Y – Yavg)^2Y = the actual data point
Yi = the predicted Y value
Yavg = the average Y valueConvert the equations to code (we can leverage the numpy dot function for SUM(XY) and SUM(X^2)):
n = X.size
sumY = Y.sum()
sumX = X.sum()
sumXY = X.dot(Y)
sumX2 = X.dot(X)denominator = (n * sumX2) – (sumX ** 2)
a = ((sumY * sumX2) – (sumX * sumXY)) / denominator
b = ((n * sumXY) – (sumX * sumY)) / denominatorSSres = Y – predictedY
SStot = Y – Y.mean()
rSquared = 1 – (SSres.dot(SSres) / SStot.dot(SStot))You can view the code and dataset on github here.
You can download the dataset here.
The full code:
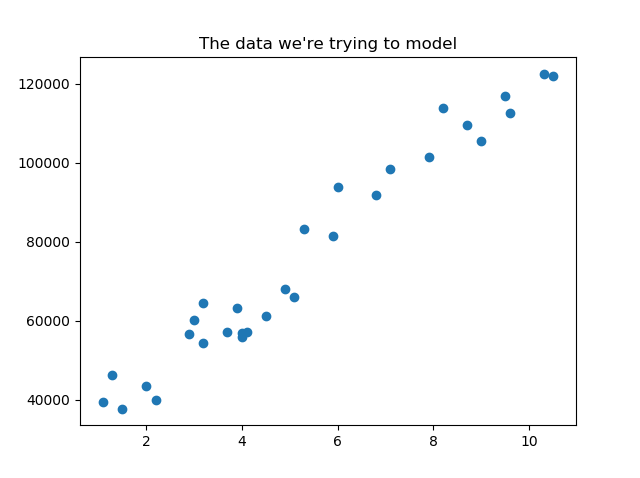
import numpy as np
import matplotlib.pyplot as plt

# create arrays for the data points
X = []
Y = []

#read the csv file
csvReader = open('Salary_Data.csv')

#skips the header line
csvReader.readline()

for line in csvReader:
    x, y = line.split(',')
    X.append(float(x))
    Y.append(float(y))

# change to numpy array
X = np.array(X)
Y = np.array(Y)

# view the data
plt.figure(1)
plt.scatter(X, Y)
plt.title("The data we're trying to model")

# use variables so that the sum, dot, and denominator is only calculated once
n = X.size
sumY = Y.sum()
sumX = X.sum()
sumXY = X.dot(Y)
sumX2 = X.dot(X)

denominator = (n * sumX2) - (sumX ** 2)
a = ((sumY * sumX2) - (sumX * sumXY)) / denominator
b = ((n * sumXY) - (sumX * sumY)) / denominator
print("the value of a is: ", a)
print("the value of b is: ", b)

# calculate predicted Y array
predictedY = a + b * X

# calculate the r-squared value
SSres = Y - predictedY
SStot = Y - Y.mean()
rSquared = 1 - (SSres.dot(SSres) / SStot.dot(SStot))
print("the value of R-squared is: ", rSquared)

# view the data and the line
plt.figure(2)
plt.scatter(X, Y)
plt.plot(X, predictedY)
plt.title("The data and our line")
plt.show()
If you use the same data set you should see the following:

-
AuthorPosts
- You must be logged in to reply to this topic.